 Sensorium DCIM Software
The modular nature of the Sensorium™ system web components makes building bespoke customer, department or operator focused dashboards and home screens not only possible but for the first time truly cost-effective.
Our services range from power and environmental auditing, system design, installation, commissioning all the way up to full ‘turn-key’ intelligent monitoring platform design, implementation and project management. This modular approach to service and our experience in working in partnership with our extensive client base ensures that the you receive the right level of service to suit your individual data centre requirements.
- Bespoke dashboards designed for the customer providing easier user functionality.

- Using the SENSORIUM™ Automatic Monitoring and Targeting (AMT) system Data Centre/Facility Managers are provided with an important tool in the developing area of energy efficiency.
- Methods such as regression monitoring can be used with this tool. This is essential in order to be compliant with the Climate Change Agreement targets, ECA scheme or EU Emissions’ Trading.
- Real time environmental monitoring is the only way to accurately track and monitor the impact of new data centre/building designs and strategies, rather than relying on multiple sources of information from in-cabinet PDU’S, chillers, air handling units, UPS, generators, etc.
- Sensorium brings all the information together in one user friendly application. Using industry standard protocols, Sensorium is able to provide real time alerts for issues that may arise such as Air con/UPS failure, Power outages, Temperature fluctuations etc.
- By accurately measuring your facility’s power load it also gives Facilities Managers/Data Centre Managers the ability to utilise and accurately capacity plan.
- With a powerful reporting engine, users have the ability to produce real-time and historical reports which coupled with regression analysis can be of real benefit when planning data centre efficiencies.
- Users are able to drill down into each individual piece of plant/hardware and retrieve real-time or historical values.
- We do not believe in a one size fits all solution, therefore Sensorium is a fully customisable, bespoke offering tailored to your exact requirements.
- With numerous blue chip companies already trusting Sensorium to monitor and manage their facility, it really is the smart choice.
DCIM is about the Enterprise
- Using the SENSORIUM™ Automatic Monitoring and Targeting (AMT) system Data Centre Managers are provided with an important tool in the developing area of energy efficiency.
- Methods such as regression monitoring can be used with this tool. This is essential in order to be compliant with the Climate Change Agreement targets, ECA scheme or EU Emissions’ Trading.
- Real time environmental monitoring is the only way to accurately track and monitor the impact of new data centre designs and strategies, rather than relying on multiple sources of information from in-cabinet PDU’S, chillers, air handling units, UPS, generators, etc.
- Sensorium brings all the information together in one user friendly application. Using industry standard protocols, Sensorium is able to provide real time alerts for issues that may arise such as Air con/UPS failure, power outages, temperature fluctuations etc.
- By accurately measuring your facility’s power load it also gives Data Centre Managers the ability to utilise and accurately capacity plan.
- With a powerful reporting engine, users have the ability to produce real-time and historical reports which coupled with regression analysis can be of real benefit when planning data centre efficiencies.
- Users are able to drill down into each individual piece of plant/hardware and retrieve real-time or historical values.
- We do not believe in a one size fits all solution, therefore Sensorium is a fully customisable, bespoke offering tailored to your exact requirements.
- With numerous blue chip companies already trusting Sensorium to monitor and manage their facility, it really is the smart choice.
Bespoke Dashboards and Home screens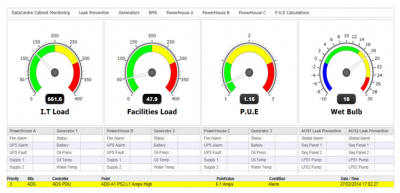

- The modular nature of the Sensorium™ system web components makes building bespoke customer, department or operator focused dashboards and home screens not only possible but for the first time truly cost-effective.
- Whether your OPS team need their information displayed as a graphical floor plan or your Data Centre Management team favour data grids or dashboards, Sensorium™ can create the perfect user interface to suit each user perfectly.
- Harnessing the power of the web and utilising tried and trusted technologies and standards (HTML, ASP, CSS, JAVASCRIPT, VBSCRIPT) the Sensorium™ G.U.I DCIM templates can be modified using standard web authoring tools to build ‘tailor made’ solutions for ‘off the peg’ budgets.
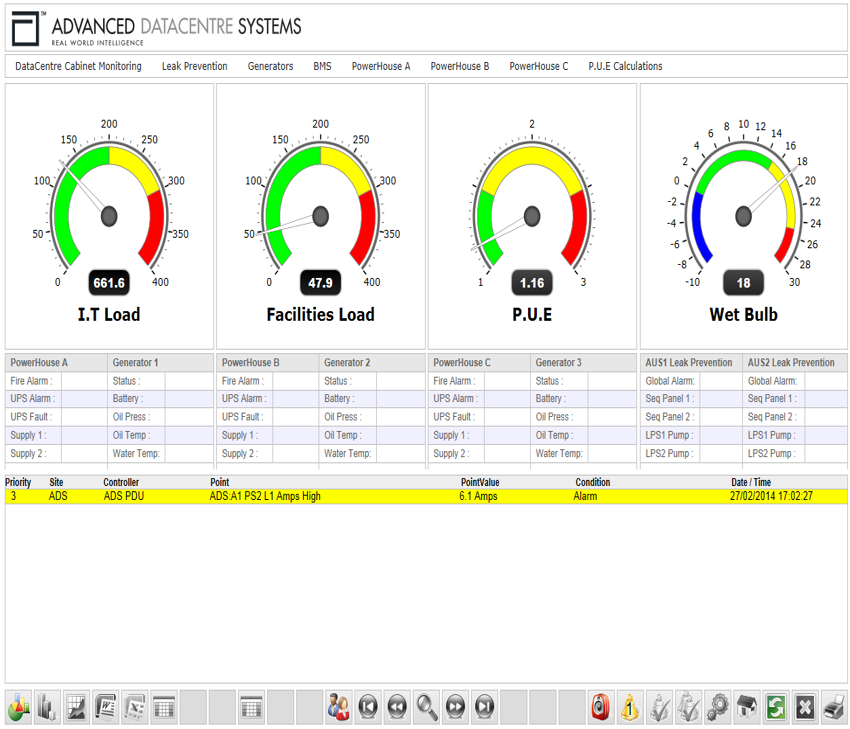
NMS Dashboard
- Designed to be displayed in a Network Management System environment, this index page is populated with configurable gauges to display building performance, the operating status of selected infrastructure monitoring points (Generators, UPS etc.) and active alarm text descriptions.
Dynamic Icon Floor Plan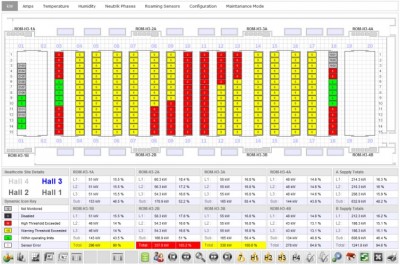
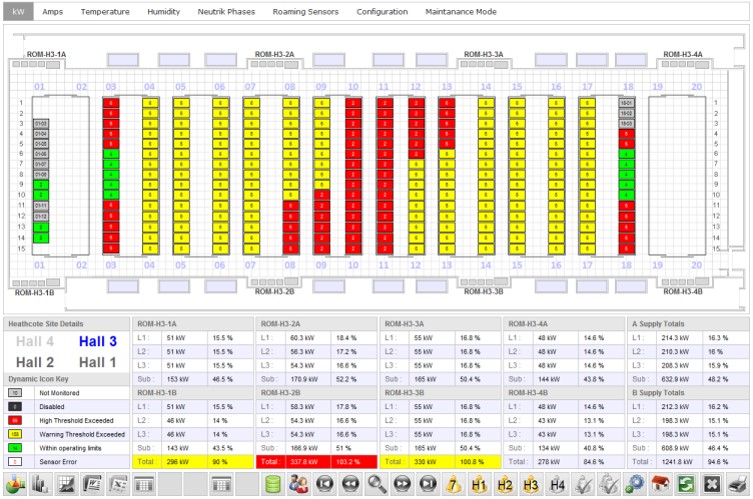
- Designed to display the physical location, and operating status of cabinets in the datacentre for any given monitored point (Amps, kW, temp, hum, security etc).
- The dynamic cabinet icons use a Red/Amber/Green (R.A.G) colour scheme to identify cabinets whose current operational status approaches or exceeds customer adjustable thresholds.
- The dynamic icons also act as hyperlinks to navigate or ‘drill down’ to view more detailed individual cabinet information.
- The Data Panel at the foot of the page provides more detailed analysis of the datacentre metrics and as with the cabinet icons, the data panel also provides R.A.G status information based on user adjustable thresholds.
Real-time and historical cabinet data
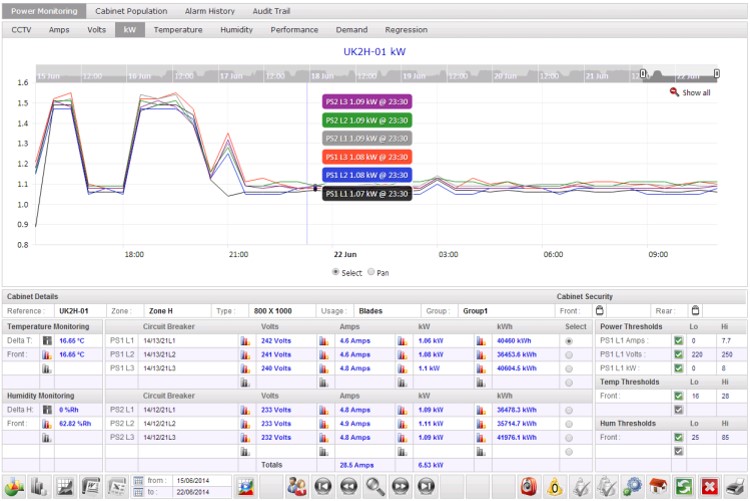 The Sensorium™ real-time communications web component can display live data from multiple sources on a single screen, regardless of the protocol or data format of the source information. Values from intelligent power strips can be displayed alongside temperature, humidity, access control and CCTV system data to provide a real-time holistic overview of the performance of the cabinet infrastructure.
User adjustable thresholds and set points of the monitored hardware can be modified from the same single interface using the same single process, again regardless of the protocol or data format of the source information.
The Historical data logging web component can be utilised to display historical data as single or 3 dimensional graphs, data grids or gauges.
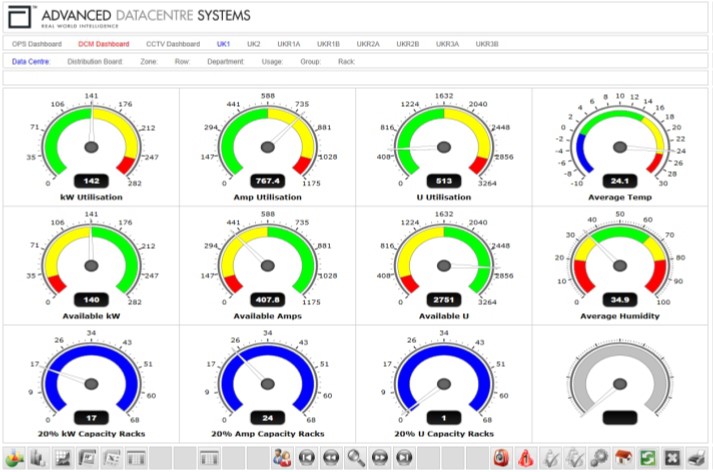
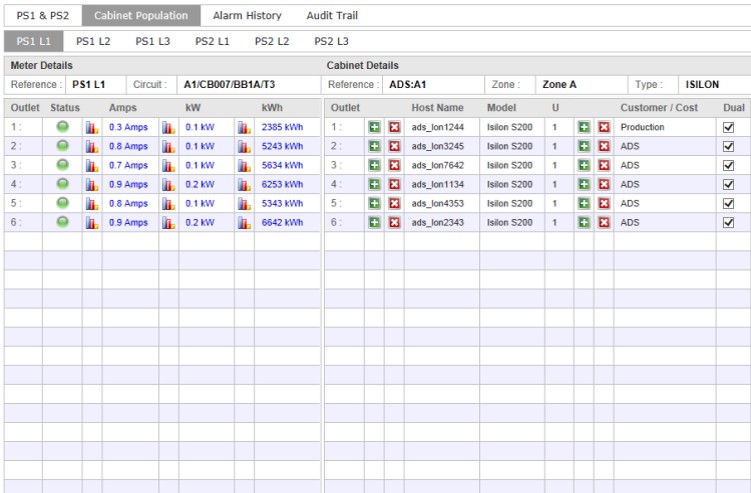
Asset Register and cabinet population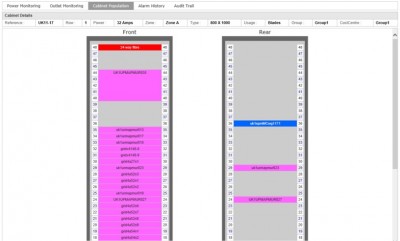

- Cabinet population and asset register information is displayed alongside real-time and historical power usage information to provide environmental monitoring system performance analysis and power usage metrics.
- The Sensorium™ internal asset register database can also be integrated with third party asset register data sources to share information adding additional functionality to your existing asset register solution.
- Per outlet intelligent power metering data logs and customer / cost centre details are associated with populated assets and used to facilitate hardware benchmarking, capacity planning, granular performance and energy usage reports and, where the metered data meets the relevant accuracy requirements, customer or interdepartmental invoices and bills
Server information and PDU socket location
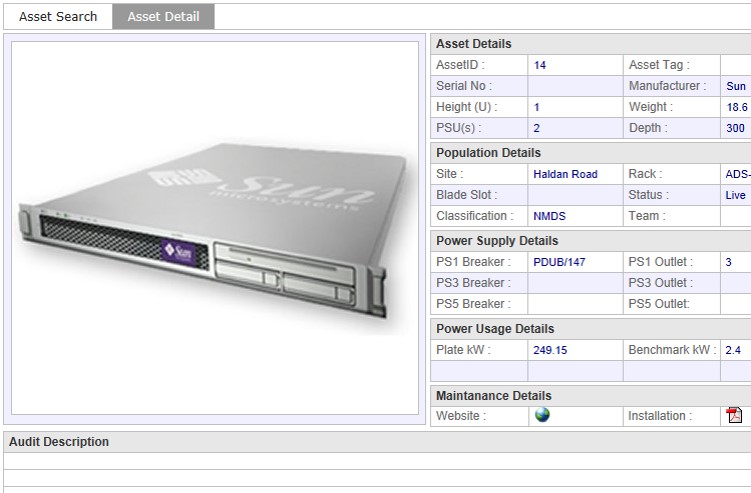
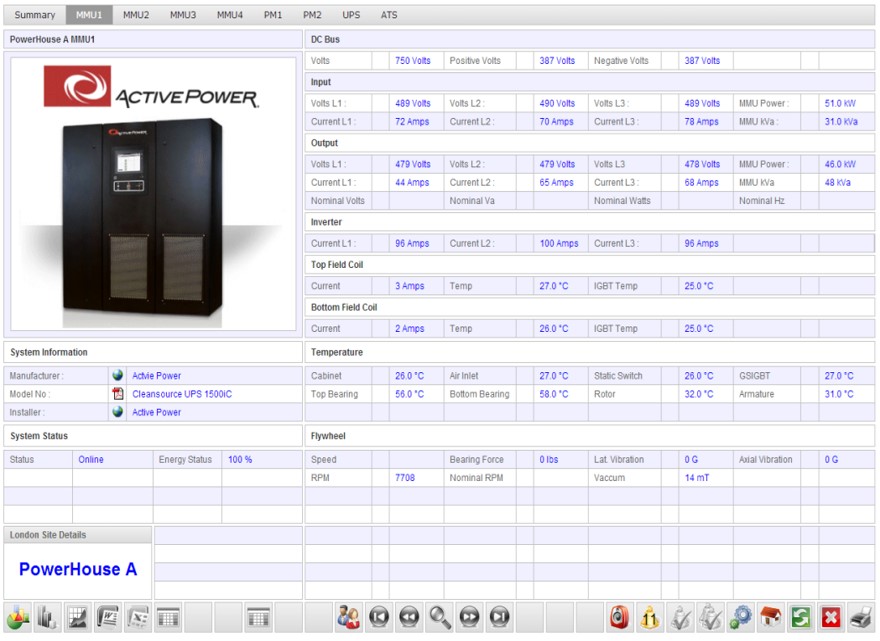
Main Plant Details Page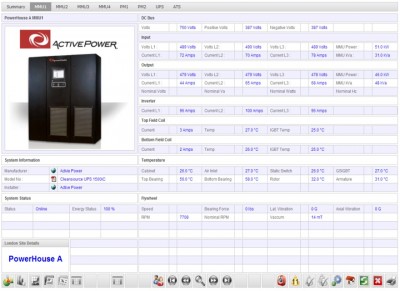
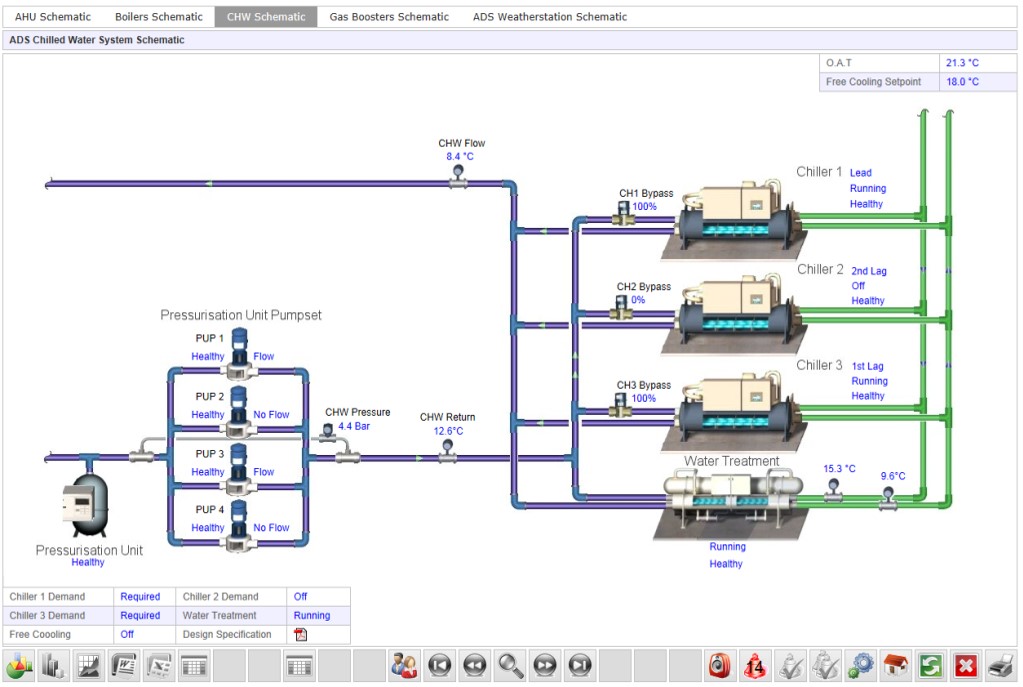
- These pages are designed to provide real-time information relating to the operation of individual items of plant.
- These pages provide all the values that one would expect from a full Building Management System in order to provide the stake holders with the information they require, to fully benchmark the operation and performance of all the component that make up the ‘holistic’ data centre monitoring model.
- Both run-time and maintenance information is provided, alongside hyperlinks to the manufacture and installer website, datasheets and O&M manual information
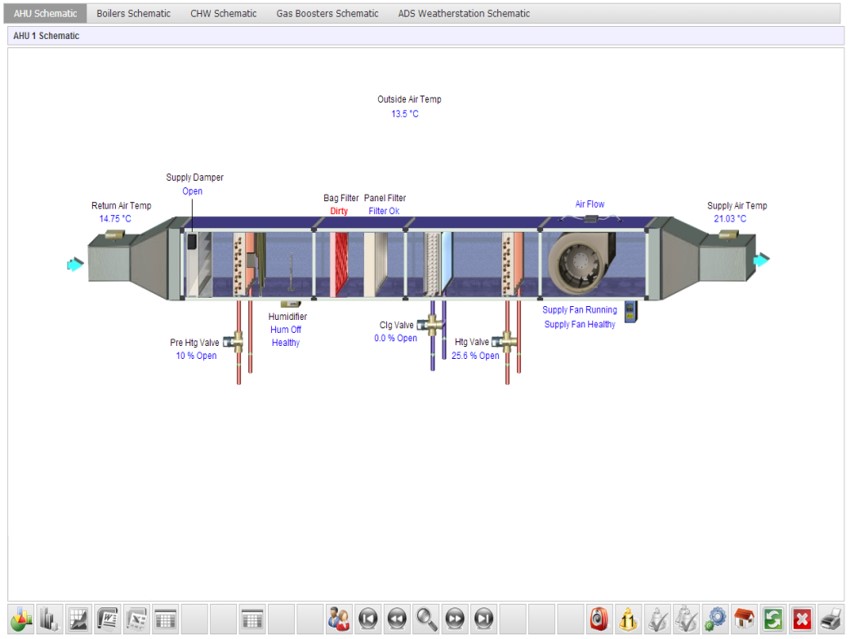
Building Services integration
- Sensorium™ offers unrivalled integration capabilities with the building services infrastructure.
- Our vendor neutral, multi-protocol communication server, combined with our 20 year track record in the integration of building management systems and established relationships with best of breed market leading, third party interface manufacturers, ensures the highest possible levels of integrated communications, even with legacy systems.
- Sensorium’s foundation has been built around providing a real-time monitoring system, not an asset register with some real time bits stuck on. DCIM have some of the standard monitoring system functionality missing. The most important of these is alarm monitoring of the system infrastructure. (PDU’s temp sensors, etc)
- Alarm Handling
- Most DCIM solutions don’t deal with alarms. They only deal with reading power to provide real metrics for capacity planning as opposed to plate values.
- Sensorium provides full alarm handing capabilities
- Alarm Translation: Taking original alarm text and translating them into a single alarm format using plain English text to handle alarm strings from source devices that have number of character limitations. This makes it simpler for non-technical personnel to support incidents
- Filtering: Alarms can be filtered out for retransmission / relay
- Alarm Retransmission: Filtered alarms can be sent to e-mail, SNMP Agents etc.
- Alarm Escalation : Single temp alarms are not high priority in and of themselves, but if there are more than X alarms in a given area, that could be indicative of an air handling unit failure, so Sensorium will generate a high priority alarm when that occurs
- Rate of change alarms: this is the future: Normally you have an alarm threshold that generates an alarm if the monitored value exceeds it, this only tells you that you have a problem. Monitoring the value and detecting if it increases a set value over time, will show you that something is about to happen. Event prediction
- Outlet power / socket assignment
- DCIMS, have issues with assigning servers to PDU Outlets (they usually are concerned with U position, and SWITCH ports).
- Sensorium can assign servers to PDU outlets. If used with per outlet monitoring power strips, this gives us the ability to monitor server power consumption. We can also assign customers or departments to individual outlets and therefore servers.
- The most important thing in this regard is the automatic benchmarking function. If we know the model number of a server, and we know the outlet its connected to then we know what power that particular model is drawing, we can average the power consumption of that particular model type across the site and present that as a real, dynamic benchmark value to be used in our capacity planning.